- Published on
How to use Flutter Time Series Charts with Firebase
Hi guys! In this blog post we will go over how to use the charts_flutter library(here is its pub.dev page) with Firebase when developing Flutter applications. More specifically, we will go over how to use the Time Series chart type to render a chart displaying dates on the x-axis and integer values in the y-axis, after fetching data from a Firebase Realtime Database.

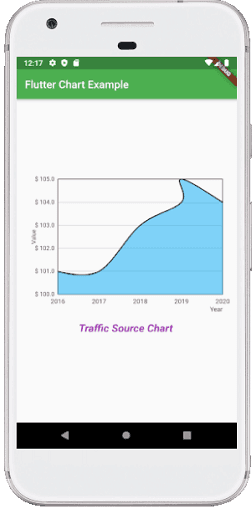
Figure 1: A chart in a Flutter application
Setup
We will need the following prerequisites before following along:
- A simple Flutter application: Here is the link the Flutter App that we will be using in this tutorial
- A Firebase project for the Flutter application. You can create one in the Firebase Console by clicking here
Development
Before starting anything note that the app shown in the GitHub repo linked above is based on a calorie tracking application. So accordingly, the Time Series chart we will be creating will be based on displaying caloric intake by date(caloric amount in the y-axis and the date in the x-axis). Now without further ado, let's get into it!
Setting up Firebase
First we have to visit the Firebase Console and create a new project:

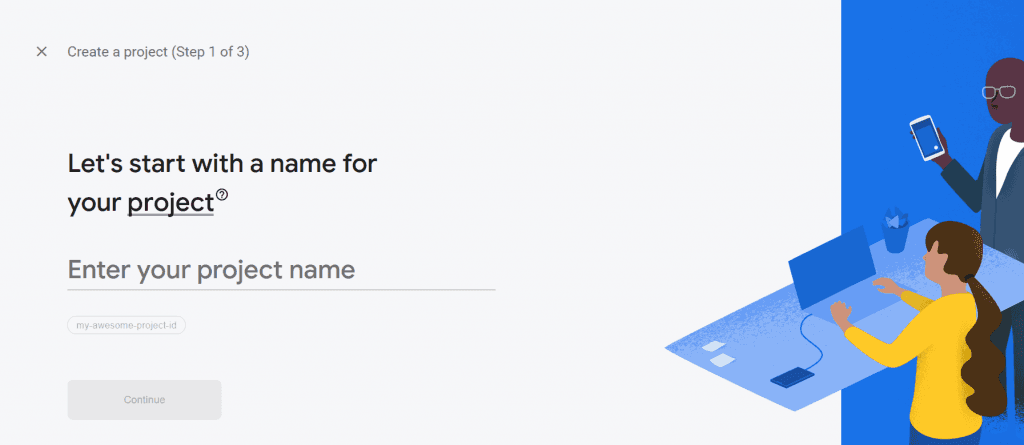
Figure 2: Firebase create project screen
After creating a project, switch to it and select 'Realtime Database' in the sidebar. In the following screen, enter your application's details and download the google-services.json file. Then make sure to place the google-services.json file in the android/app directory of your project folder like so:

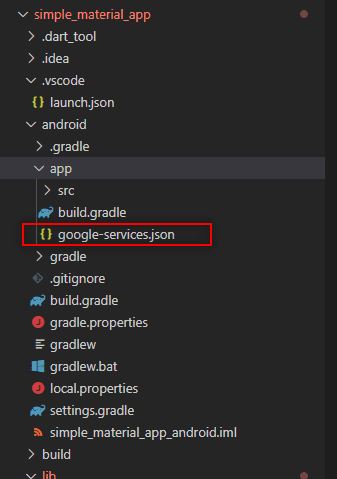
Figure 3: Google services file location for Flutter application
As a final step make sure to follow the instructions for setting up the build.gradle files that Google provides as the last step.
Setup Project Files
Before we move onto the application setup, we need to make sure the android/build.gradle and android/app/build.gradle files contain the necessary data. For the sake of brevity, just copy and paste these file contents from the files in my GitHub repo.
Application Setup
First open up the starter Flutter app in VSCode(or Android Studio if that's what you prefer) and run the command flutter run to instal the required packages defined in the pubspec.yaml file and build the project.
Once the project is successfully built, let's add the following code to the lib/main.dart file:
import 'package:flutter/material.dart';
import 'package:simple_material_app/utils/datetime-chart.dart';
import 'package:provider/provider.dart';
import 'package:simple_material_app/services/shared_preference_service.dart';
import 'package:firebase_database/ui/firebase_animated_list.dart';
import 'package:firebase_core/firebase_core.dart';
import 'package:firebase_database/firebase_database.dart';

void main() async {
  WidgetsFlutterBinding.ensureInitialized();
  await Firebase.initializeApp();
  await SharedPreferencesService().init();
  runApp(MyApp());
}

class MyApp extends StatelessWidget {
  // This widget is the root of your application.
  @override
  Widget build(BuildContext context) {
    return MaterialApp(
      title: 'Flutter Demo',
      theme: ThemeData(
        primarySwatch: Colors.blue,
        visualDensity: VisualDensity.adaptivePlatformDensity,
      ),
      home: MyHomePage(title: 'Flutter Demo Home Page'),
    );
  }
}

class MyHomePage extends StatefulWidget {
  MyHomePage({Key? key, required this.title}) : super(key: key);

  final String title;

  @override
  _MyHomePageState createState() => _MyHomePageState();
}

class _MyHomePageState extends State<MyHomePage> {
  int _counter = 0;

  void _incrementCounter() {
    setState(() {
      _counter++;
    });
  }

  @override
  Widget build(BuildContext context) {
    return Scaffold(
        appBar: AppBar(
          title: Text(widget.title),
        ),
        body: Container(
          child: DateTimeChart(),
        ));
  }
}
Now I'll give a brief explanation of the important parts of the code above:
void main() async: In the main method of this application we first callWidgetsFlutterBinding.ensureInitialized();to get an instance of theWidgetsBindingclass and to allow us to setup Firebase. Next, we setup Firebase viaawait Firebase.initializeApp();. After that,await SharedPreferencesService().init()is used to setup theshared_preferencespackage, which allows us to store and cache values on disk. Finally, we callrunApp()to inflate theMyApp()widget and attach it to the screenclass MyApp: This is the root widget in our applicationclass MyHomePage: This is the widget that is responsible for rendering the DateTimeChart() widget, which contains the Time Series chart that we're buildingbuild(): This method is used to render the UI specified by this widget
Then we can add to the lib/services/shared_preference_service.dart file:
import 'package:shared_preferences/shared_preferences.dart';

class SharedPreferencesService {
  static late SharedPreferences _sharedPreferences;

  Future<void> init() async {
    _sharedPreferences = await SharedPreferences.getInstance();
  }

  static String sharedPreferenceFirstLaunchKey = 'FIRSTLAUNCH';
  static String sharedPreferenceDarkThemeKey = 'DARKTHEME';

  static Future<bool> setFirstLaunch({required bool to}) async {
    return _sharedPreferences.setBool(sharedPreferenceFirstLaunchKey, to);
  }

  static Future<bool> setDarkTheme({required bool to}) async {
    return _sharedPreferences.setBool(sharedPreferenceDarkThemeKey, to);
  }

  static bool getFirstLaunch() {
    // The "??" operator means "if null".
    // This means: if '_sharedPreferences.getBool(sharedPreferenceFirstLaunchKey)' is null then return true, else return former value
    return _sharedPreferences.getBool(sharedPreferenceFirstLaunchKey) ?? true;
  }

  static bool getDarkTheme() {
    return _sharedPreferences.getBool(sharedPreferenceDarkThemeKey) ?? true;
  }
}
Now for an explanation of the important parts of the above code:
class SharedPreferencesService: This class functions as a wrapper around an instance of theSharedPreferencesclasssetFirstLaunch(): This method is used to toggle thesharedPreferncesFirstLaunchKeyvariable betweentrueandfalse. This can be useful when deciding which screen to present to the user upon opening the app for the first timesetDarkTheme(): This method is used to toggle between enabling the dark theme or not??: This operator basically denotes that: "if the left side variable is null then return the value on the right side of the operator, if not just return the left side variable"
Then we can add to the lib/pages/datetime-chart.dart file:
import 'package:charts_flutter/flutter.dart' as charts;
import 'package:firebase_database/firebase_database.dart';
import 'package:firebase_core/firebase_core.dart';
import 'package:flutter/material.dart';
import 'dart:convert';
import 'package:intl/intl.dart';
import 'package:simple_material_app/models/food-track-entry.dart';
import 'package:simple_material_app/utils/database-service.dart';
import 'package:datetime_picker_formfield/datetime_picker_formfield.dart';

class DateTimeChart extends StatefulWidget {
  @override
  _DateTimeChart createState() => _DateTimeChart();
}

class _DateTimeChart extends State<DateTimeChart> {
  late List<FoodTrackEntry>? _data = null;
  static List<charts.Series<FoodTrackEntry, DateTime>>? _chartData = null;
  String productName = 'Add Food';
  late FoodTrackEntry addFoodTrack;
  DateTime _dateTimeValue = DateTime.now();
  final _addFoodKey = GlobalKey<FormState>();
  DatabaseService databaseService = new DatabaseService();


  @override
  void initState() {
    super.initState();

    fetchChartData();
  }

  void fetchChartData() {
    DatabaseReference _dbRef = FirebaseDatabase.instance.ref();
    addFoodTrack = new FoodTrackEntry(_dateTimeValue, 0);
    List<charts.Series<FoodTrackEntry, DateTime>> resultChartData;
    List<FoodTrackEntry> resultData = [
      new FoodTrackEntry(new DateTime(2022, 03, 11), 50),
      new FoodTrackEntry(new DateTime(2022, 03, 12), 100),
      new FoodTrackEntry(new DateTime(2022, 03, 13), 120),
      new FoodTrackEntry(new DateTime(2022, 03, 14), 150),
    ];

    _dbRef.once().then((DatabaseEvent databaseEvent) {
      final databaseValue = jsonEncode(databaseEvent.snapshot.value);
      Map<String, num> caloriesByDateMap = new Map();
      if (databaseValue != null) {
        Map<String, dynamic> jsonData = jsonDecode(databaseValue);
        var dateFormat = DateFormat("yyyy-MM-dd");

        for (var foodEntry in jsonData["foodTrack"].values) {
          var trackedDateStr =
              DateTime.parse(foodEntry["createdOn"].toString());
          DateTime dateNow = DateTime.now();
          var trackedDate = dateFormat.format(trackedDateStr);
          if (caloriesByDateMap.containsKey(trackedDate)) {
            caloriesByDateMap[trackedDate] =
                caloriesByDateMap[trackedDate]! + foodEntry["calories"];
          } else {
            caloriesByDateMap[trackedDate] = foodEntry["calories"];
          }
        }
        List<FoodTrackEntry> caloriesByDateTimeMap = [];
        for (var foodEntry in caloriesByDateMap.keys) {
          DateTime entryDateTime = DateTime.parse(foodEntry);
          caloriesByDateTimeMap.add(new FoodTrackEntry(entryDateTime,
              int.parse(caloriesByDateMap[foodEntry].toString())));
        }

        caloriesByDateTimeMap.sort((a, b) {
          int aDate = a.date.microsecondsSinceEpoch;
          int bDate = b.date.microsecondsSinceEpoch;

          return aDate.compareTo(bDate);
        });

        resultData = caloriesByDateTimeMap;
        return caloriesByDateTimeMap;
      } else {
        print("databaseSnapshot key is NULL");
        return null;
      }
    }).then((caloriesByDateTimeMap) {
      if (caloriesByDateTimeMap != null) {
        resultChartData = [
          new charts.Series<FoodTrackEntry, DateTime>(
              id: "Sales",
              colorFn: (_, __) => charts.MaterialPalette.blue.shadeDefault,
              domainFn: (FoodTrackEntry sales, _) => sales.date,
              measureFn: (FoodTrackEntry sales, _) => sales.calories,
              data: caloriesByDateTimeMap)
        ];
      } else {
        resultData = _createDateTimeSeriesData();
        resultChartData = [
          new charts.Series<FoodTrackEntry, DateTime>(
              id: "Sales",
              colorFn: (_, __) => charts.MaterialPalette.blue.shadeDefault,
              domainFn: (FoodTrackEntry sales, _) => sales.date,
              measureFn: (FoodTrackEntry sales, _) => sales.calories,
              data: resultData)
        ];
      }

      setState(() {
        _data = resultData;
        _chartData = resultChartData;
      });
    });
  }


  Widget _addFoodButton() {
    return IconButton(
      icon: Icon(Icons.add_box),
      iconSize: 25,
      color: Colors.white,
      onPressed: () async {
        setState(() {});
        _showFoodToAdd(context);
      },
    );
  }

  _showFoodToAdd(BuildContext context) {
    return showDialog(
        context: context,
        builder: (context) {
          return AlertDialog(
            title: Text(productName),
            content: _showAmountHad(),
            actions: <Widget>[
              FlatButton(
                onPressed: () => Navigator.pop(context), // passing false
                child: Text('Cancel'),
              ),
              FlatButton(
                onPressed: () async {
                  Navigator.pop(context);
                  addFoodTrack.date = _dateTimeValue;
                  await databaseService.addFoodTrackData(addFoodTrack);
                  fetchChartData();
                },
                child: Text('Ok'),
              ),
            ],
          );
        });
  }

  Widget _showAmountHad() {
    return new Scaffold(
      body: Column(children: <Widget>[
        _showAddFoodForm(),
      ]),
    );
  }

  Widget _showAddFoodForm() {
    final dateTimeFormat = DateFormat("yyyy-MM-dd");

    return Form(
      key: _addFoodKey,
      child: Column(children: [
        TextFormField(
          decoration: const InputDecoration(
              labelText: "Calories *",
              hintText: "Please enter a calorie amount"),
          validator: (value) {
            if (value == null || value.isEmpty) {
              return "Please enter a calorie amount";
            }
            return null;
          },
          onChanged: (value) {
            addFoodTrack.calories = int.parse(value);
            print(addFoodTrack.calories);
          },
        ),
        DateTimeField(
          format: dateTimeFormat,
          decoration: InputDecoration(labelText: "Date: "),
          onShowPicker: (context, currentValue) async {
            _dateTimeValue = await showDatePicker(
                    context: context,
                    initialDate: DateTime.now(),
                    firstDate: DateTime(1900),
                    lastDate: DateTime(2100)) ??
                _dateTimeValue;
            addFoodTrack.date = _dateTimeValue;
          },
        )
      ]),
    );
  }


  static List<FoodTrackEntry> _createDateTimeSeriesData() {
    List<FoodTrackEntry> resultData = [
      new FoodTrackEntry(new DateTime(2022, 03, 11), 50),
      new FoodTrackEntry(new DateTime(2022, 03, 12), 100),
      new FoodTrackEntry(new DateTime(2022, 03, 13), 120),
      new FoodTrackEntry(new DateTime(2022, 03, 14), 150),
    ];

    return resultData;
  }

  @override
  Widget build(BuildContext context) {
    if (_chartData != null) {
      return Scaffold(
          appBar: AppBar(
              elevation: 0,
              bottom: PreferredSize(
                preferredSize: const Size.fromHeight(5.0),
                child: Row(
                  mainAxisAlignment: MainAxisAlignment.spaceBetween,
                  children: <Widget>[
                    new Text("Add Food Entry"),
                    _addFoodButton(),
                  ],
                ),
              )),
          body: new Container(
            child: charts.TimeSeriesChart(_chartData!, animate: true),
          ));
    } else {
      return CircularProgressIndicator();
    }
  }
}
Now for an explanation of the datetime-chart.dart file:
_data: This variable will hold the resultingMap<String, dynamic>object from theDatabaseReference _dbRefvariable. The data will be populated after the database table records have been sent from the Firebase Realtime Database instance_chartData: This variable will hold an instance ofList<chart.Series<`FoodTrackEntry`, DateTime>>which will be used as data for thecharts.TimeSeriesChartinstance that will render the chart onto the screeninitState(): This lifecycle method will be fired before thebuild()method. It is responsible for callingfetchChartData()fetchChartData(): This is the method that fetches chart data from the Firebase Realtime database that we have setup in the previous steps. It first queries the Firebase Realtime database instance for allfoodTrackrecords. Once recieved, it aggregates the data into aMap<String, num>with the key being the date that the food item was tracked and the value being the total number of calories for a given date. Next, the string datetime values used as keys in the formerMap<String, num>are converted toDateTimeinstances and stored as thedatefield in aListofFoodTrackEntryobjects. Their second fieldcalorieswould contain the calorie amounts for each date(the values of the formerMap<String, intobject, in other words). If the database instance does not return any data for whatever reason, then we just supply aListof some sample`FoodTrackEntry`instances so that we always have something to render in thecharts.TimeSeriesChart. ThesetState()just updates the value of the_dataand_chartDatavariables based on the database query results(this is not really needed tbh)_addFoodButton(): This method is responsible for displaying a button that will show the 'Add Food' modal when clicked_showFoodToAdd(): This method is responsible for displaying the 'Add Food' modal where the user can add a newFoodTrackEntryby submitting the form that is presented in that modal. We are creating anonClicklistener that calls theDatabaseServiceclass, which we will create below_showAddFoodForm(): This method's main purpose is to render a form consisting of thecaloriesanddatefields in the 'Add Food' modal_createDataTimeSeriesData(): This method is used to provide a list of sample`FoodTrackEntry`instances as a backup, in case the Firebase Database instance is unable to fetch anyfoodTrackrecordsbuild(): This is the method that renders thecharts.TimeSeriesChart()onto the screen
Next we can create a models folder with a new file called food-track-entry.dart and add the following code to it:
class FoodTrackEntry {
  DateTime date;
  int calories;

  FoodTrackEntry(this.date, this.calories);
}
This is the class used by our charts.TimeSeriesChart() in providing the x and y values for the time series chart that we're building.
Creating our Database Service class
Now its time to create the DatabaseService class. Let's create a file called database-service.dart in the utils folder and add the following code to it:
import 'package:charts_flutter/flutter.dart' as charts;
import 'package:firebase_database/firebase_database.dart';
import 'package:firebase_core/firebase_core.dart';
import 'package:flutter/material.dart';
import 'package:simple_material_app/models/food-track-entry.dart';

class DatabaseService {
  DatabaseService();
  DatabaseReference _foodTrackRef =
      FirebaseDatabase.instance.ref().child("foodTrack");
  final DateTime today =
      DateTime(DateTime.now().year, DateTime.now().month, DateTime.now().day);

  Future addFoodTrackData(FoodTrackEntry foodTrackEntry) async {
    print(foodTrackEntry.toString());

    return await _foodTrackRef.push().set({
      'calories': foodTrackEntry.calories,
      'createdOn': foodTrackEntry.date.toString(),
    });
  }
}
Now for an explanation of this class:
_foodTrackRef: We establish a connection with the Firebase Realtime database with this variabletoday: variable to get today's dateaddFoodTrackData(): This method is used to push the newFoodTrackEntryrecord up to the Firebase Realtime database
Test the app
If the steps mentioned above are followed we should be able to build the application successfully. After the build is successful, we can add FoodTrackEntry instances to the chart by clicking the '+' button on the top right of the screen. Finally, after creating sufficient data points we should see something similar to the following screenshots:
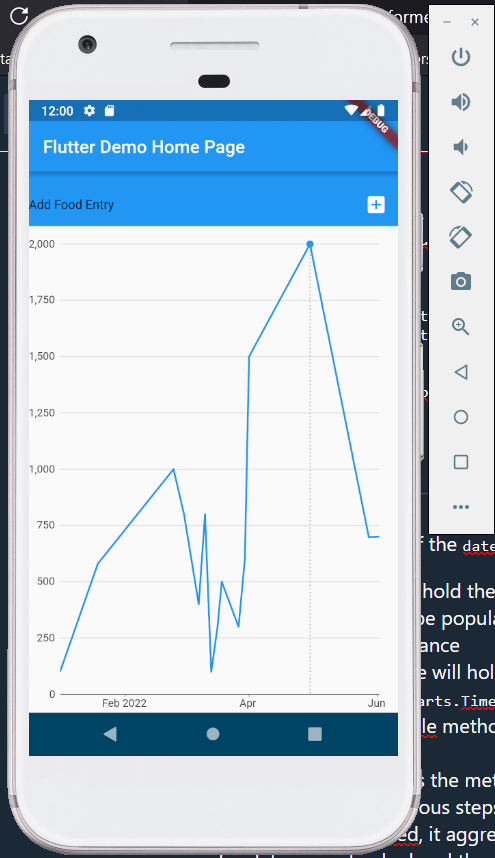
Figure 4: DateTime chart image 1
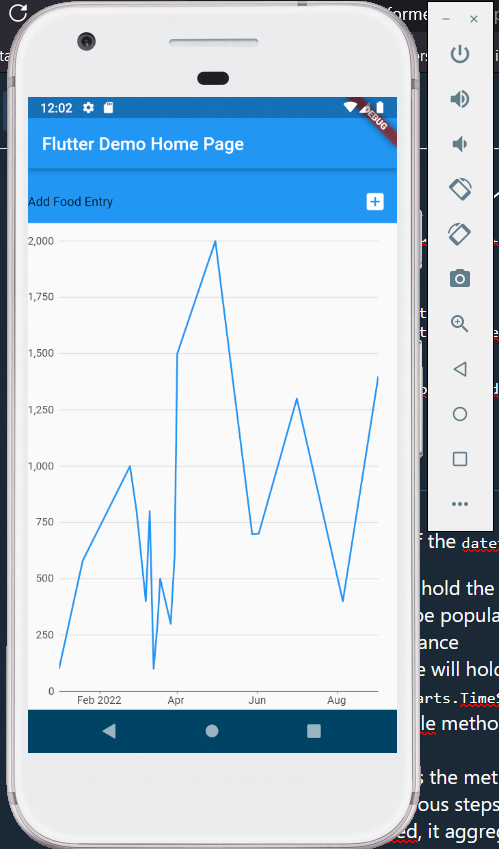
Figure 5: DateTime chart image 2
Conclusion
Thanks for reading this blog post!
If you have any questions or concerns please feel free to post a comment in this post and I will get back to you when I find the time.
If you found this article helpful please share it and make sure to follow me on Twitter and GitHub, connect with me on LinkedIn and subscribe to my YouTube channel.